
The Environment Agency's new PFAS thresholds for freshwater
- Post Date
- 30 January 2026
- Read Time
- 5 minutes

Last week, the UK’s Environment Agency (EA) published research on Developing thresholds for managing PFAS in the water environment.[1] Richard Ogden and Jonathan Parry from SLR’s Per- and polyfluoroalkyl substances (PFAS) team offer some initial thoughts on the document, with the intention of facilitating discussion within the community of PFAS and controlled-waters practitioners.
The recent publication of the ‘Developing thresholds for managing PFAS in the water environment’ is a great piece of work applying the standard Environmental Quality Standards (EQS) guidance to the current EU toxicological benchmark, which are the basis of several regulatory values / discussions. However, while the assessment acknowledges it is based on ‘conservative’ assumptions, the derived thresholds are very low.
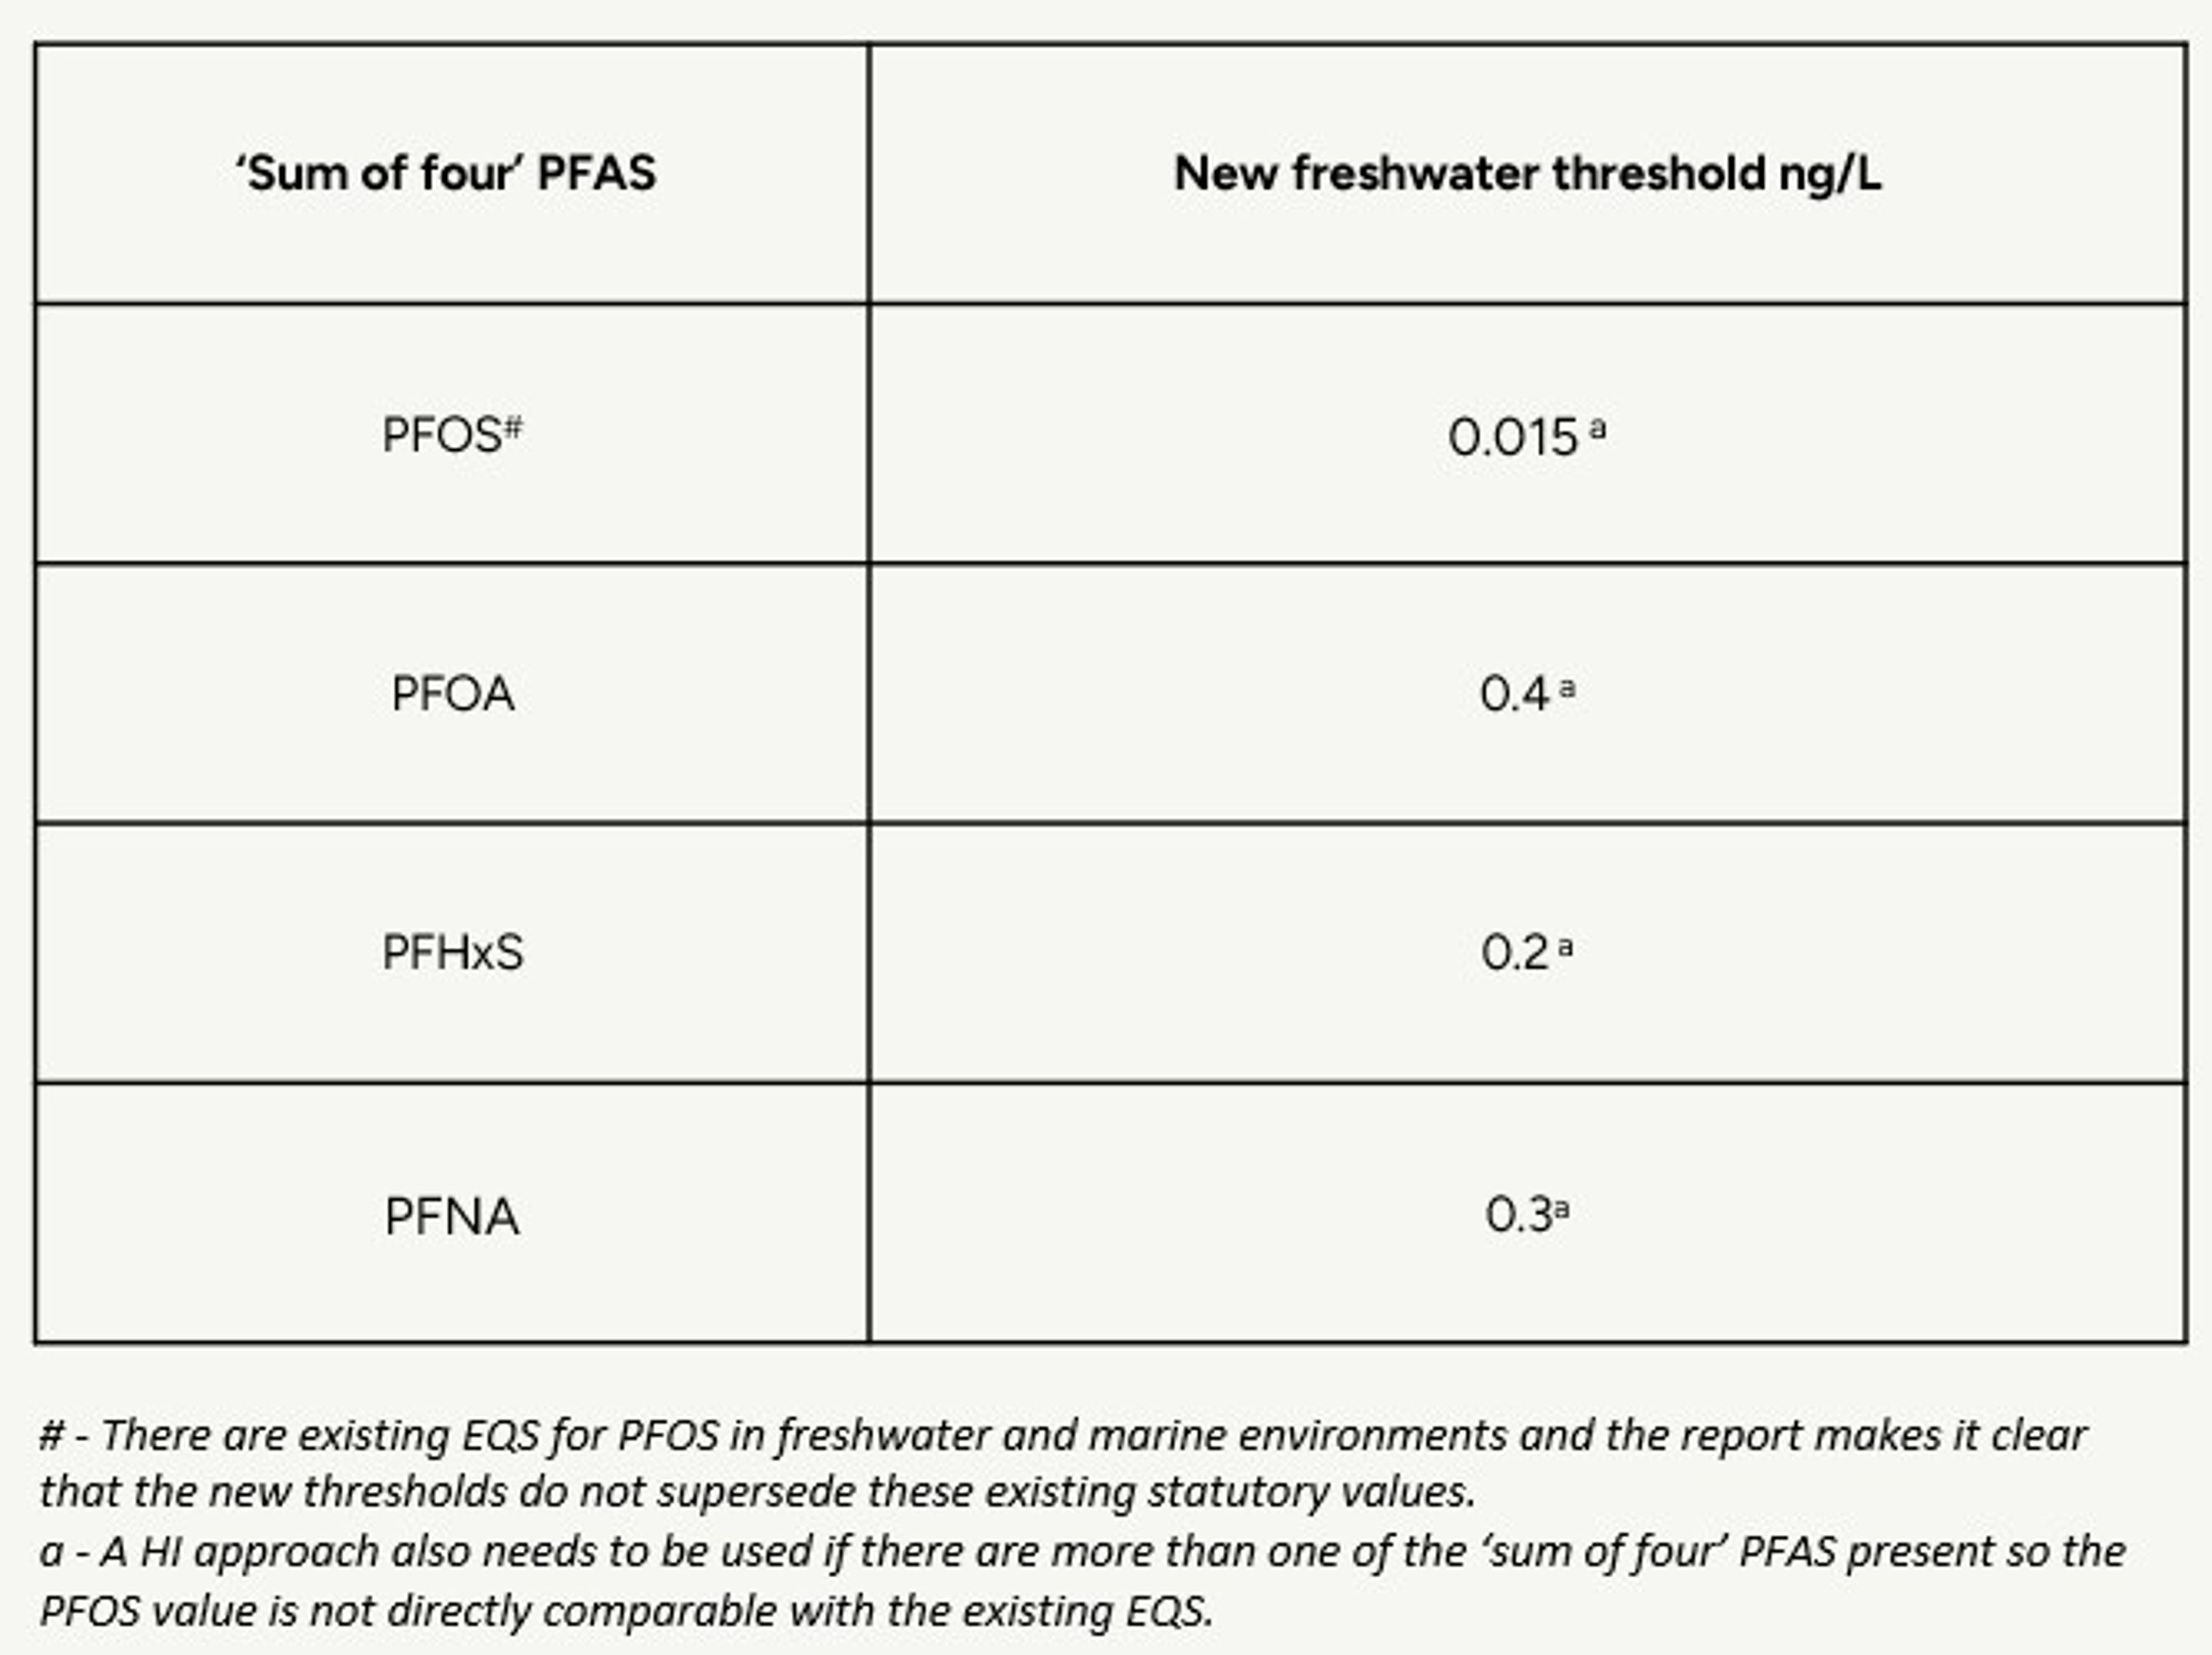
Below is a summary of the new freshwater thresholds for the ‘Sum of four’ PFAS derived by the EA’s report.
The publication of these new thresholds are a great starting point for an industry conversation on how applicable (and achievable) these values are to UK controlled waters risk assessments.
Formal EQS need to be derived in line with ‘Guidance No 27 - Deriving Environmental Quality Standards’,[2] which require Quality Standards (QS) to be derived for a range of surface water receptor endpoints before an EQS is set as the lowest of these QS. See Figure 4 in the guidance.[2]
The existing EQS for PFOS (Freshwater: 0.65 ng/L) related to the QS that protects people eating fish from impacted fresh and salt-water environments (QSbiota,hh), which was determined to be the most sensitive endpoint in the PFOS EQS Dossier.[3] In deriving the current EQS, the maximum concentration allowable in fish was set based on a Tolerable Daily Intake (TDI) for PFOS (150 ng/kg body weight) published by the European Food Standards Agency (EFSA) in 2008.[4] However, EFSA updated their opinion in 2020 and set a new, revised Tolerable Weekly Intake (TWI) of 4.4 ng/kg bw for the ‘Sum of four’ PFAS (PFOS, PFOS, PFHxS, and PFNA), which is much lower than the 2008 TDI.[5]
The EA’s ‘Developing thresholds for managing PFAS in the water environment’ is an admirable extrapolation of the existing EQS approach taking account of this updated EFSA TWI but it only presents updated thresholds for freshwater (not marine or estuarine) environments. So where can we go from here in refining these values to facilitate science-based but pragmatic regulation and assessment of PFAS within UK freshwaters?
In deriving the updated thresholds, the EA’s report makes the explicit assumption that, due to known bioaccumulation and persistence of PFAS, the QS for human consumption of fish (QSbiota,hh) remains the critical exposure route driving any new thresholds for freshwater (QS were not calculated for any other endpoints). But in the UK, is this true?
The new thresholds in the EA report are based on the “default value for daily fish consumption is 0.114kg per day per person, which equates to 0.00163kg fish per kg bw per day, using an average body weight per person of 70kg. The default value for the proportion of the diet from fishery products is 0.2”. This is all in line with the EQS guidance,[6] but how representative are these assumptions of the average UK diet?
While some European countries may have such high fish consumption rates, the UK is a long way from achieving our recommended two portions of fish per week and we generally only eat marine species – even the declining numbers of dedicated anglers probably do not achieve these levels of consumption. Based on the ‘National Diet and Nutrition Survey: diet, nutrition and physical activity’,[7] an average fish consumption rate for 11 – 80-year-olds can be estimated as ~0.017 kg/day and Google searches suggest that 80% - 90% of that is of marine origin (i.e. seafood). So, a more realistic freshwater fish consumption rate for the UK is arguably 0.0034 kg/day (0.017x0.2). Does this amount to a significant exposure route for the UK population and so justify making it the basis for freshwater quality standards when compared to other freshwater endpoints considered under the EQS framework, such as drinking water supply or ecotoxic effects?
Even if it is, using a consumption rate that reflects the UK diet (0.0034 kg/day) would potentially produce more sustainable freshwater thresholds:
- PFOS: 0.516 ng/L
- PFOA: 14.875 ng/L
- PFNA: 11.302 ng/L
- PFHxS: 6.207 ng/L
Notwithstanding the above, the UK still needs to give far greater consideration to suitable marine water standards for PFAS to ensure adequate protection of static shellfish and migratory fish, which provide the majority of the UK fish intake which people are encouraged to consume for health benefits.
Find out more about SLR’s PFAS services and get in touch with our team
Click here—————————————————-
References
- https://assets.publishing.service.gov.uk/media/6973722c51bd707cb10ed958/Developing_thresholds_for_managing_PFAS_in_the_water_environment_-_report.pdf
- https://rvs.rivm.nl/documenten/guidance-no-27-deriving-enviromental-quality-standards-version-2018
- https://circabc.europa.eu/sd/a/027ff47c-038b-4929-a84c-da3359acecee/PFOS%20EQS%20dossier%202011.pdf.
- https://efsa.onlinelibrary.wiley.com/doi/10.2903/j.efsa.2008.653
- https://efsa.onlinelibrary.wiley.com/doi/full/10.2903/j.efsa.2020.6223
- https://rvs.rivm.nl/sites/default/files/2019-04/Guidance%20No%2027%20-%20Deriving%20Environmental%20Quality%20Standards%20-%20version%202018pdf
- https://assets.publishing.service.gov.uk/media/614b16c8d3bf7f71919a7f47/Follow_up_stud_2020_main_report.pdf
Recent posts
-
-

Chile lidera América Latina en el Sustainability Yearbook 2026 de S&P Global
by Germán Saenz
View post -